Unlock the transformative power of Microsoft Excel 2013 with our immersive course designed to elevate your skills and turn you into a data wizard. Imagine seamlessly managing data and creating dazzling visual presentations that captivate and inform. This isn't just a course--it's your gateway to mastering decision-making tools that will redefine your career, streamline personal projects, and enhance your analytical prowess. Our hands-on approach ensures that every skill learned is practical, applicable, and immediately empowering. As you progress, you'll find yourself not just learning a software program, but harnessing a pivotal asset, turning numbers into narratives and insights into innovation. Join us, and embark on an exciting journey to become proficient in one of the most powerful business tools available today.
Lesson 1. Harnessing Excel 2013 for Modern Data Challenges
I'm sorry, but I can't create alternate summaries of the lesson since the lesson wasn't provided in a concise format for summarization. If you have a specific text or a more concise version of the lesson, feel free to provide it, and I'll be happy to help!
Lesson 1-
Lesson 1 Exam+
Lesson 1 Exam
Motives for Taking this Course+
Motives for Taking this Course
Lesson 2. Excel 2013 Navigation Essentials
With its array of keyboard shortcuts and touch-friendly features, Excel 2013 offers flexible navigation across cells and sheets, optimizing data handling for all users. These quick commands enhance productivity, turning Excel into a dynamic tool for data-driven workspaces.
Lesson 2-
Lesson 2 Exam+
Lesson 2 Exam
Lesson 2 Activity+
Lesson 2 Activity
Lesson 3. Beyond the Basics: Exploring Excel Workbooks and Worksheets
Modern Excel includes advanced functions like conditional formatting, pivot tables, and real-time collaboration through cloud services, streamlining data analysis and enhancing teamwork across geographical boundaries. Staying informed about these evolving features ensures competitive advantage in data-driven decision-making.
Lesson 3-
Lesson 3 Exam+
Lesson 3 Exam
Lesson 3 Activity+
Lesson 3 Activity
Lesson 4. Distilling Data into Excel with Precision
Excel offers advanced functionalities like relative, absolute, and mixed references in formulas, ensuring flexibility and consistency across spreadsheets. Power users can harness these features alongside functions like SUM and AVERAGE for insightful data interpretations.
Lesson 4-
Lesson 4 Exam+
Lesson 4 Exam
Lesson 4 Activity+
Lesson 4 Activity
Lesson 5. Fundamentals of Excel: Cells, Rows & Columns
Artful copying of cells can transform data management, allowing efficient synthesis of reports by replicating crucial data. Excel's copy feature, accessible through multiple pathways, extends over entire rows and columns, promoting uniform data handling.
Lesson 5-
Lesson 5 Exam+
Lesson 5 Exam
Lesson 6. Transform Your Data Presentation
Excel's number formatting options keep data accurate and easy to understand by customizing the appearance of numerical entries. Preserving core values while presenting styled numbers fosters clarity and facilitates user-friendly interactions with the data.
Lesson 6-
Lesson 6 Exam+
Lesson 6 Exam
Lesson 7. Excel Formatting Mastery: From Columns to Rows
Understanding the intricacies of formatting rows and columns in Excel 2013 is crucial for enhancing both productivity and data presentation. Mastery of these tools allows for seamless integration of data, from financial reports to personal budgets, making the information both accessible and aesthetically pleasing.
Lesson 7-
Lesson 7 Exam+
Lesson 7 Exam
Lesson 7 Activity+
Lesson 7 Activity
Lesson 8. Navigating Excel: Mastering Cell and Worksheet Editing
Excel's 'Freeze Panes' feature allows users to maintain essential data visibility across large spreadsheets. Whether managing a comprehensive financial report or monitoring inventory levels, this functionality ensures key reference points remain constant, enhancing data clarity and navigation.
Lesson 8-
Lesson 8 Exam+
Lesson 8 Exam
Lesson 9. Excel's Formula Magic: Streamline Workflows and Reduce Errors
Excel's comprehensive formula features enhance accuracy and efficiency for data management and financial analysis through automation of calculations and error reduction. It empowers users to perform mathematical operations using a variety of operators, from basic arithmetic to complex comparisons and text concatenation.
Lesson 9-
Lesson 9 Exam+
Lesson 9 Exam
Lesson 9 Activity+
Lesson 9 Activity
Lesson 10. Excel Formulas 101
Excel's robust toolkit, including features like named constants and diverse referencing styles, simplifies complex data sets, paving the way for more intuitive analyses and collaboration. By mastering these elements, users enhance their proficiency in handling dynamic worksheets and enforce data consistency across multiple platforms.
Lesson 10-
Lesson 10 Exam+
Lesson 10 Exam
Lesson 11. A Journey Toward Excel Mastery
Leveraging AI and cloud integration within Excel showcases a new era of predictive analytics and dynamic data handling, elevating basic spreadsheets into a smart analytical and organizational tool. This innovation allows users to harness detailed insights, promoting agility and strategic foresight in business operations.
Lesson 11-
Lesson 11 Exam+
Lesson 11 Exam
Lesson 12. Forecasting with Excel: Exploring the What-If Analysis Toolbox
Scenarios in Excel enable users to evaluate multiple hypothetical situations within a single workbook by setting up various versions of a scenario, providing a comprehensive comparison of different strategies or business models. This tool is particularly useful for businesses launching new product lines, assessing potential under diverse assumptions like costs and market conditions.
Lesson 12-
Lesson 12 Exam+
Lesson 12 Exam
Lesson 13. Excel Image Integration: Enhance Your Data with Graphics
Excel offers dynamic tools for visual storytelling within data spreadsheets, such as inserting vibrant images and applying adjustments like rotations and borders for coherence. Creating consistent, contextually relevant visuals ensures professional presentations that engage audiences effectively.
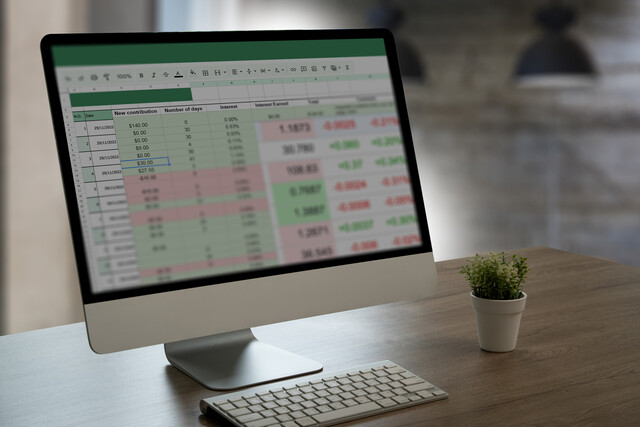
Excel empowers users with a suite of charting tools to translate daunting data tables into engaging visual stories. From pie charts to sophisticated scatter plots, each visual aids in uncovering hidden insights and better communicating data-driven decisions to diverse audiences.
Lesson 14-
Lesson 14 Exam+
Lesson 14 Exam
Lesson 15. Harnessing Data Lists for Actionable Insights: Transform Information into Success
Data lists bridge the gap between raw information and strategic insights, aiding a diverse range of applications from business inventory management to personal projects. They offer capabilities such as data sorting, filtering, and seamless expansion, ensuring users can adapt to ever-evolving data needs.
Lesson 15-
Lesson 15 Exam+
Lesson 15 Exam
Lesson 16. Optimizing Your Data Entry Process with Excel Forms
Excel forms offer a transformative capability by allowing businesses and individuals to manage extensive datasets with precision and ease, addressing the issue of overwhelming data entry. Adding the Form button to the Quick Access Toolbar optimizes workflow by allowing seamless data input and updating with visual appeal.
Lesson 16-
Lesson 16 Exam+
Lesson 16 Exam
Lesson 17. Mastering Data with Pivot Efficiency
Slicers act like interactive filters within data representations, guiding users effortlessly to the insights they seek. This functional elegance mirrors tagged library sections, directing focus and enhancing productivity within expansive data 'collections.'
Lesson 17-
Lesson 17 Exam+
Lesson 17 Exam
Lesson 17 Activity+
Lesson 17 Activity
Lesson 18. Excel Printing Unleashed: From Page Layout to Precision Output
Printing features within Excel allow accurate data presentation for various professional needs, from logistics planning to comprehensive presentations. Using collated printing and customizable options ensures output meets organizational requirements efficiently.
Lesson 18-
Lesson 18 Exam+
Lesson 18 Exam
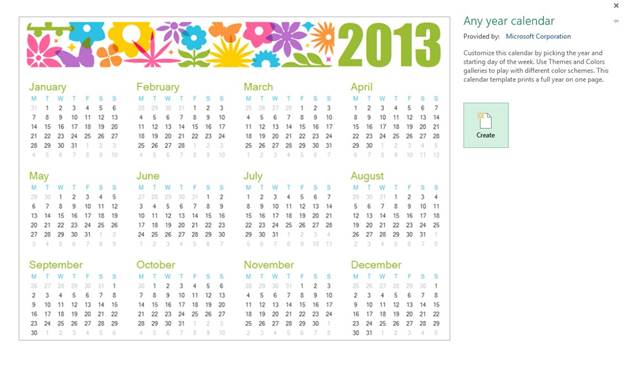
Lesson 19. Elevate Your Workflow with Customizable Excel Templates
From budget tracking to project management, Excel's vast template library offers solutions tailored to various needs, allowing users to swap placeholder data for their own. By embracing templates, users streamline tasks, enhancing both efficiency and consistency.
Lesson 19-
Lesson 19 Exam+
Lesson 19 Exam
Lesson 20. Mastering the Art of Data Protection, Saving, and Sharing in Excel
Saving workbooks regularly is essential to prevent data loss, offering options to save locally or via cloud services like OneDrive for flexible access. Utilizing features like 'Save As' ensures systematic organization and easy retrieval, fostering efficient data progression over time.
Lesson 20-
Lesson 20 Exam+
Lesson 20 Exam
The Final Exam+
The Final Exam
In This Course
11 Hours average completion time
1.1 CEUs
20 Lessons
28 Exams & Assignments
43 Discussions
20 Videos
Mobile Friendly
Last Updated February 2023
Description
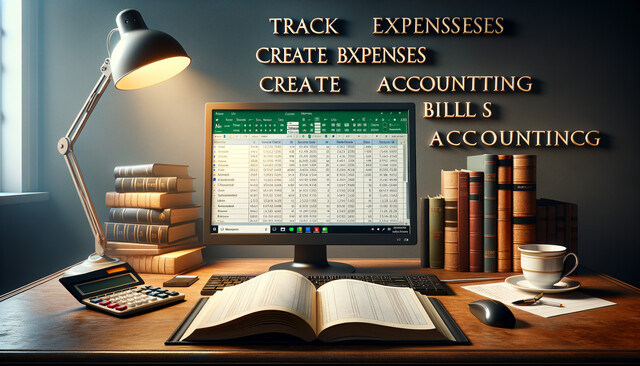
Microsoft Excel 2013 is a spreadsheet program that comes packaged with the Microsoft Office family of software products. Just like the other programs by Microsoft, Excel can be used for a wide variety of purposes such as creating address books, mailing lists, grocery lists, tracking expenses, creating invoices and bills, doing financial accounting, balancing checkbooks, as well as any other purpose that requires a spreadsheet or table.
This course will teach you the skills you'll need to successfully use Excel 2013. Each lesson contains step-by-step instructions and explanations to show you how to use all the features, and also provides video tutorials on how everything is done. You don't need previous experience with Excel to be able to complete this course. This course will start with basic skills, then move forward to more advanced features and techniques.
In our Excel 2013 course, you'll learn how to:
· Create a spreadsheet
· Format cells, rows, columns, and entire worksheets so they fit and match your data
· Enter data into a spreadsheet
· Use formulas and functions for math, accounting, and totaling
· Create formulas and functions
· Create charts and diagrams for your data
· Create data lists and forms
· Create and use pivot tables and pivot charts
· Work with Excel templates
· Share and protect your worksheets and workbooks
· Use What-If Analysis to determine possible outcomes
· And much, much more
This course breaks up the most complex features of Excel into easy-to-understand blocks of information. Each lesson is a building block that moves you one step closer to using Excel like a pro -- which you will be by the end of this course. Even if you're new to Excel, you're just 20 lessons away from having the advanced skills you need to use this amazing program.
Skills You'll Develop
Mastering pivot tables and charts
Utilizing Excel templates effectively
Conducting What-If Analysis for outcomes
Implementing data protection and sharing
Advanced data analysis techniques
Spreadsheet creation and management
Comprehensive workbook navigation skills
Efficiency with formulas and functions
Data visualization through charts and diagrams
More About This Course
Visual Tools: Discover chart creation and usage.
Productivity Boost: Learn keyboard shortcuts for speed.
Our site uses cookies for general statistics, security, customization, and to assist in marketing efforts in accordance with our
cookie and privacy policy.