As with other Office programs, you can insert images, such as JPEG files, into your Visio document. That said, images you insert into Visio do not appear as regular images as they do with Microsoft Word. Instead, they are shapes. They do not have connection points like regular Visio shapes, but you can use a connector to connect images.
Insert Images from Your Computer
To insert an image that's saved on your computer into a drawing, go to the Insert tab.
Click the Pictures button in the Illustrations group.
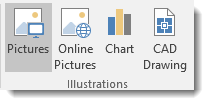
This will allow you to search for local images on your computer to insert into your drawings.
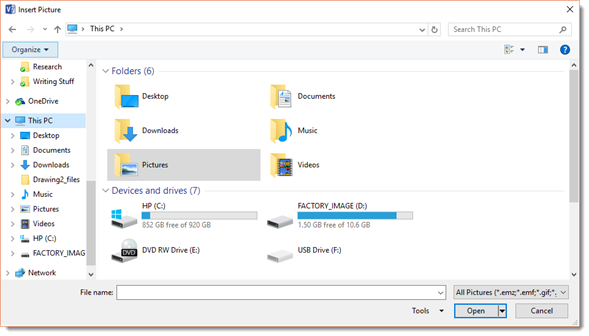
Locate the image you want to insert. Click on it to select it, then click the Open button.

You can then move the picture around your page, or use the bounding box to resize it.
If you double click on the picture, you'll bring up the Picture Tools Format tab in the Ribbon, shown below.
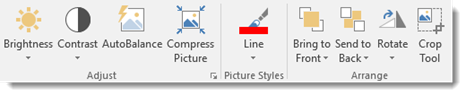
You'll find the image adjustment tools that are common to all Microsoft Office programs under this tab. You can adjust the brightness, compress the picture to reduce the size, rotate the image, crop the image, etc. We'll talk about these later in this lesson.
Insert Online Images
You can also insert images you find using Bing search.
To do this, click the Online Pictures button in the Illustrations group under the Insert tab.
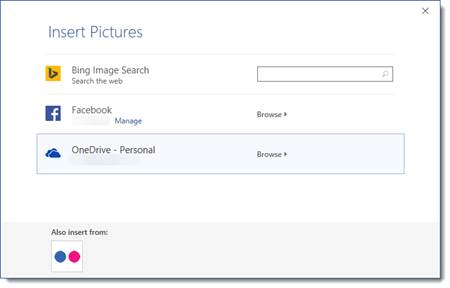
When you click the button, this window will appear:
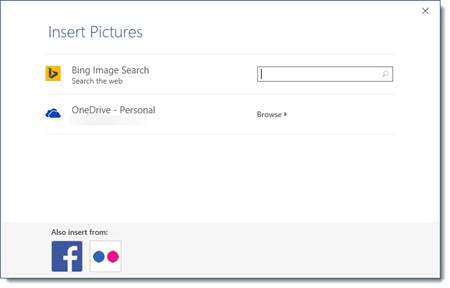
If you want to search for ClipArt, type in a description of what you're looking. Use keywords, such as coffee, woman, shopping, etc.
We're going to type in coffee.
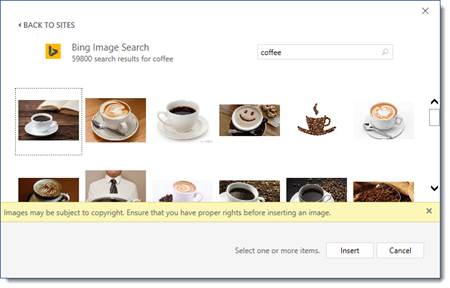
Select the picture you want by clicking on it, then click Insert.
Make sure you check the copyright to be sure you can use the image. To avoid copyright issues, either use your own images, images that are in the public domain (no copyright), or purchase images from stock photo sites where you will receive a license with the image.
Inserting Images from OneDrive
In addition to inserting pictures from Bing search, you can also insert pictures stored on your OneDrive.

Click Browse to the right one OneDrive.
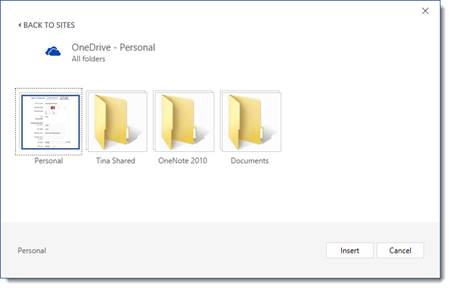
Find the image you want, then click the Insert button.
Insert Images from Facebook and Flickr
To insert images from Facebook or Flickr, click the Online Pictures button again.
For Facebook, click the Facebook icon at the bottom of the window.
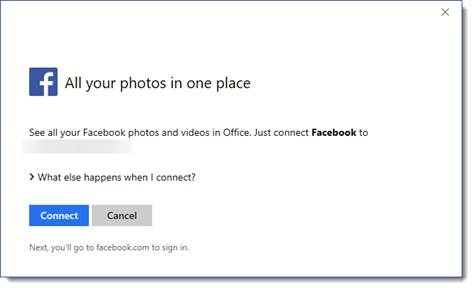
Click Connect.
You'll then be prompted to sign in to your Facebook account:
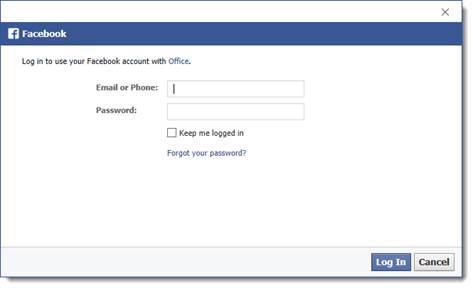
Click Log in. Once you're logged in, you'll see this screen:
Click Done.
You'll then see Facebook listed with all the other locations where you can search for pictures:
If you want to add pictures from Flickr, click the Flickr button at the bottom to connect to your Flickr account.
Inserting CAD Drawings
To insert a CAD image into your drawing, click on the CAD Drawing button in the Illustrations group under the Insert tab.
You will then see the Insert AutoCad dialogue box.
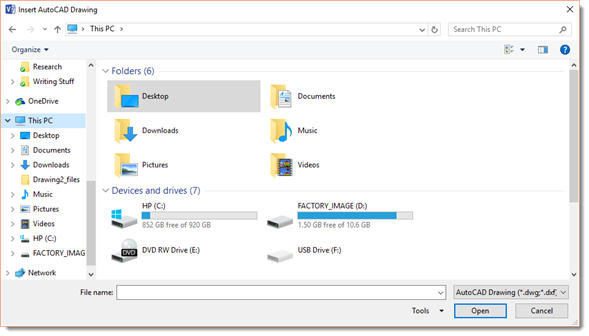
Locate the CAD drawing on your computer, then click the Open button.
Resizing Images
When you insert or paste an image into a drawing, it may not be the size you need it to be in order to fit in with the drawing. No worries. You can always resize it.
Resize images by dragging a corner handle of bounding box. Drag inward to make the image smaller. Drag outward to make the image larger.
Cropping Images
Another way to reduce the size of a picture is to crop it. When you crop a picture, you cut away the outer edges of the picture to create a new version. Cropping can be helpful when you want the focus to be on a certain part of the image. Cutting away edges can help achieve that.
To crop an image, select it so that the Picture Tools Format tab opens.
Go to the Arrange group and click on the Crop Tool button.

You'll now see crop marks around your image, as shown above. The crop marks appear on the corners and sides of the image. They are black in color.
Click and drag your mouse inward, toward the center of the picture, using any one of these marks. Click and drag inward on the image until you have cropped away the area you want to get rid of in the image.

As you can see the image above, the area to be cropped out is shaded.
Click outside of the image to remove the cropped area.
Adjusting the Quality of Images
You can also adjust the quality of the images you insert into a drawing by using the tools provided under the Picture Tools Format tab.
These tools are pictured below.
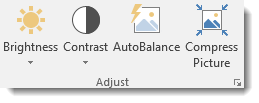
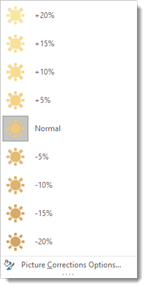
If you click the Brightness dropdown, you can adjust the brightness of the image.
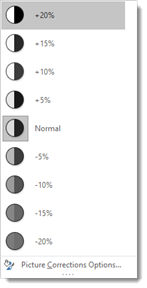
Click the Contrast dropdown to adjust the contrast.
AutoBalance automatically adjusts the brightness and contrast of the image for you.
The Compress Picture button compresses the inserted image to reduce its file size. You may sacrifice a little of the color quality if you do this.
Connecting Images to Shapes
In the snapshot below, you can see that we have a process shape and an image that we inserted.

We want to connect the shape to the image; however, the image does not have connection points as a typical Visio shape would have.
To connect the shape to the image, right click in the Drawing window to bring up the mini menu.
Click on the Connector button.
Drag the connector from a connection point on the shape and point it toward the image.

Inserting a Chart
To insert a chart, navigate to the Insert tab and click the Chart button in the Illustrations group. It looks like this:

You will then see a chart inserted onto the current page in your drawing.
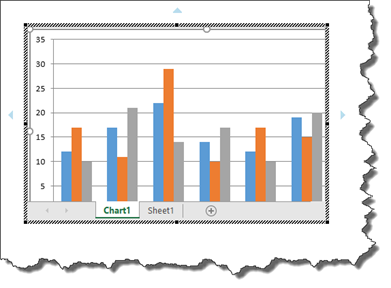
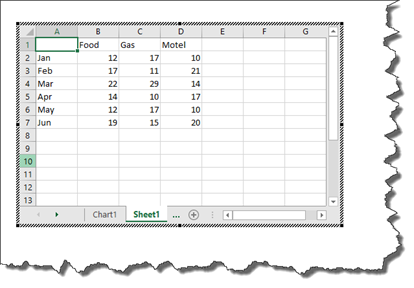
Notice that the chart has two tabs: Chart1 and Sheet1. Add data by clicking on the tab entitled Sheet1. This is an Excel workbook, as pictured below.
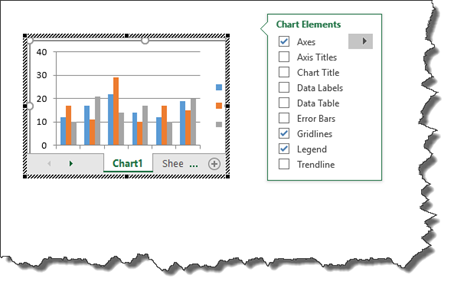
Format the chart by clicking on the Chart1 tab.
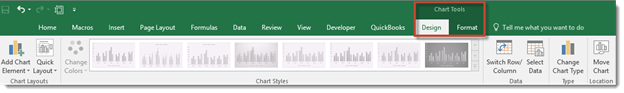
Whenever you insert a chart into Visio, the Ribbon will change and show the tabs that you'd find in Excel. Using these tabs, you can insert screenshots and WordArt into your chart, as well as some other Excel commands. You'll also notice that it contains the Chart Tools Design and Format tabs.
You can use the Chart Tools Design and Format tabs to help you design and format your chart.
Using the Chart Tools
Whenever you insert a new chart into your drawing, the Chart Tools Design and Chart Tools Format tabs will open, as pictured below.
This is the Chart Design tab.

You can also click on the chart Format tab, to the right of the Chart Design tab.

Let's take a look at the chart tools available on the Design tab.

The Chart Styles group contains different styles of charts. You can apply these styles to one of your charts by simply selecting your chart, then clicking on a style.
Use the Chart Layouts group on the Ribbon to add chart elements or change the layout.
Now look at the Type and Data groups.
The Data group lets us select an existing data set or edit one, switch rows to columns or vice versa, select, and edit data.
In the Type group, we can change the chart type. Say, for example, that after we entered our data, we realized that maybe a pie chart wasn't the right way to convey it. We've decided instead to use a graph chart. To do so, we'd click the Change Chart Type button and select a new chart.
Now let's take a look at the Format tab for charts:

Use the Current Selection group to change the formatting of the current selection.
Use the Insert Shapes group to add and insert shapes. Use the Shape Styles section to change the style of your shapes. You can also change WordArt styles that appear in your chart.
The Shape Styles group allows you to apply styles to shapes in the chart.
The WordArt Styles group allows you to format any WordArt in your chart.
The Arrange group lets you arrange your data and images, including text wrap and position.
Creating Flowcharts and Organization Charts
The Different Types of Flowcharts
The amount of flowchart templates available to you in Visio 2016 depends on what version of Visio you are using. Visio Standard 2016 has four flowchart templates. Visio Professional contains nine flowchart templates. This includes the four from Visio Standard plus five more.
The types of charts are listed below. The first four are found in the Standard and Professional versions.
1. Basic Flowchart
2. Cross-functional Flowchart
3. Work Flow Diagram
4. Work Flow Diagram 3-D
5. Business Process Model and Notation (BPMN)
6. IDEFo
7. Specification and Description Language (SDL) Diagram
8. Microsoft SharePoint 2010 Workflow
9. Microsoft SharePoint 2016 Workflow
We'll learn how to create a few of these in this section.
Creating a Basic Flowchart
To create a basic flowchart, go to the File tab, click New. Click on the Flowchart category if necessary, then open the Basic Flowchart.
As an example for this lesson, we're going to create the process a company uses for hiring a new employee. But before we begin, let's take a quick look at the stencils available in the Shapes window.
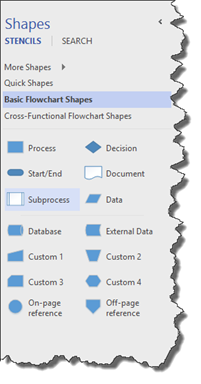
As you'll notice, right now, we are looking at the Basic Flowchart Shapes.

We can also click on More Shapes, Quick Shapes, or Cross-Functional Shapes to get access to more stencils.
Below are the stencils under Cross-Functional Flowchart Shapes.
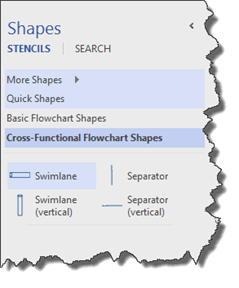
For the time being, let's go back to Basic Flowchart Shapes.
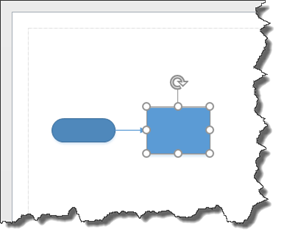
To start creating your flowchart, drag a Start/End shape to the drawing page, as pictured below.

Now, hover your mouse above the shape until you see the blue triangles appear. Move your mouse over the right arrow and choose the Process shape from the Quick Shapes menu. Remember, this will add another shape for us.
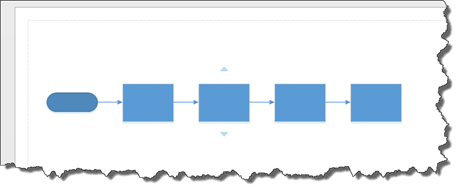
Our flowchart now looks like this:
Add three more Process shapes to your page for a total of four. Of course, this is not a rule that whenever you create a basic flowchart that you have to add these exact shapes. We are just guiding you through creating your first flowchart.
Next, go to the Shapes window. Drag a Process shape onto your drawing page. Use the Dynamic Grid to align it with the first Process shape that's already on the page.
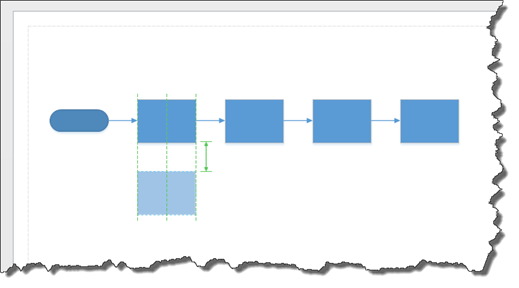
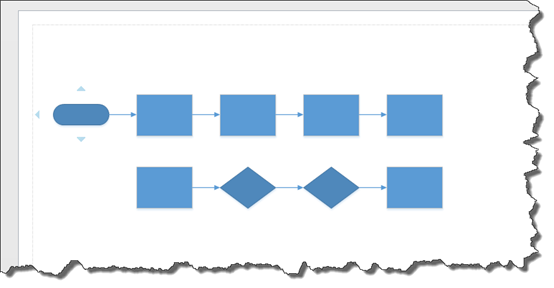
Add two Decision shapes follows by another Process shape to the right of the newest Process shape.
Use Dynamic Connectors to connect the shapes, as shown below.
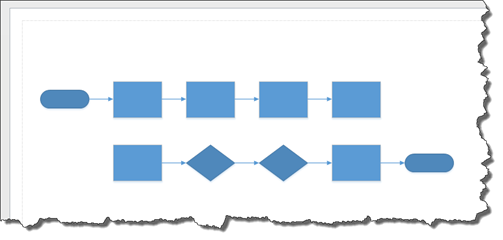
Drag a Start/End shape and place it to the right of the last Process shape.
Use a Dynamic Connector to connect it.
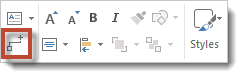
Next, right click anywhere on the page. Choose the Connection Tool from the mini menu, as highlighted below.
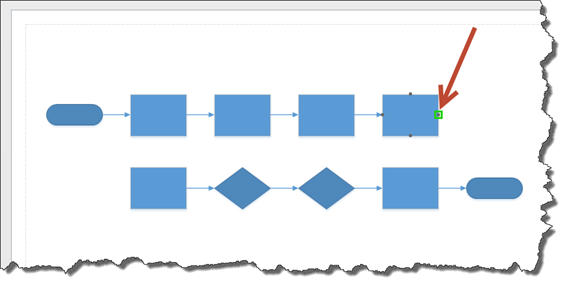
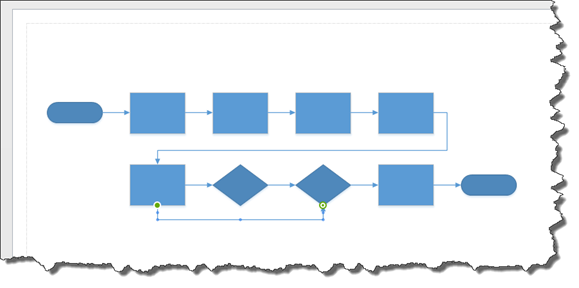
We're going to connect the Process shape on the far right of our page with the Process shape found in the second row on the far left.
To do this, select the first Process shape. We're going to use the center connection point on the right side.
Hold your left mouse button down and drag the dotted line that appears to the center connection point located on the left side of the other Process shape.
Once you've glued the connection point, release your mouse.
We're going to follow the same steps to connect the Process shape in the second row to the second Decision shape.
Drag a bounding box around the shapes in the second row. We want to make more room in our flowchart.
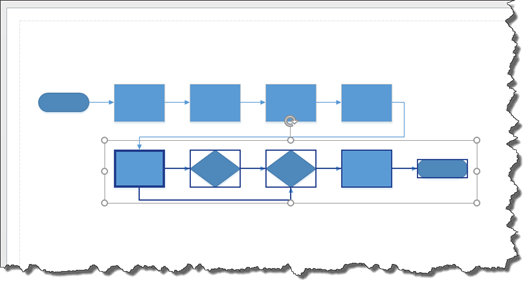
If you're unsure how to move the bounding box, here's a reminder. Once you've dragged the bounding box, you can move your mouse over the border of the bounding box until you see the cursor turn to a four-way arrow. With your left mouse button held down, move the box and shapes.
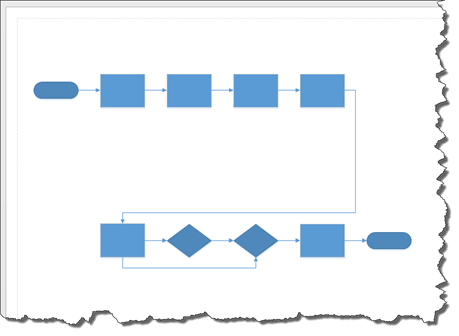
Drag a Document shape and place it below the last Process shape in the first row. Use a Dynamic Connector that links the Process shape to the Document shape.
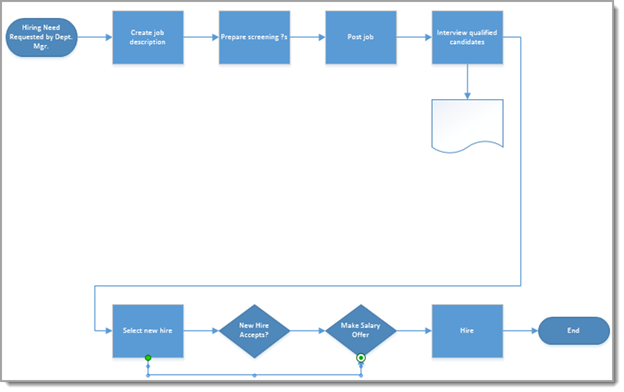
In the snapshot above, you can see your basic flowchart drawing. Now you can add text labels to your flowchart by adding text to the shapes.
Creating Swimlane Diagrams
A swimlane diagram, also known as a cross-functional flowchart, can be more effective than a typical flowchart because they are organized by role or department instead of by steps.
In other words, a flowchart focuses on the steps to be taken and the order of those steps � or the flow. A swimlane diagram shows whose responsible for the steps.
If you look at the flowchart we just created, you will notice that we couldn't list who was responsible for the steps. To do so would have made the flowchart crowded and hard to read.
The reason they are called swimlane diagrams is because each process is placed in its own lane, so to speak, and based on who is responsible for that process step.
Let's create a swimlane diagram to show you what we mean.
Click the File tab to go to the Backstage area. Click New on the left, then select the Flowchart category.
Select the Cross-Functional Flowchart template, and open it.
You'll see this dialogue box appear over your Drawing page.
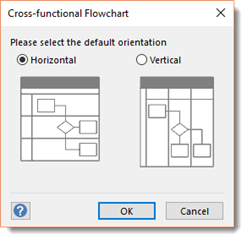
Select if you want the orientation of the diagram to be horizontal or vertical. The differences in these orientations are illustrated for you.
We are going to choose Horizontal.
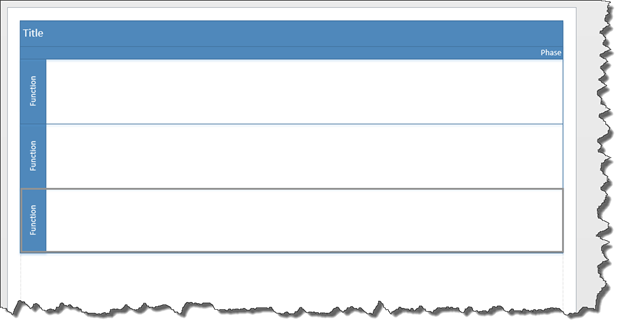
A title band and two swimlanes then appear on your page, as shown below.
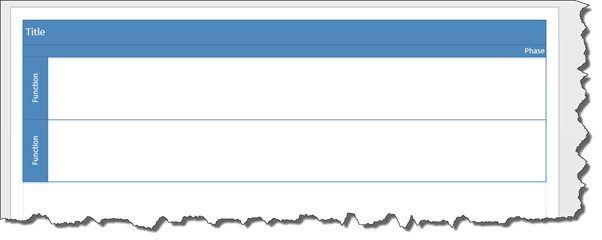
Let's add another swimlane.
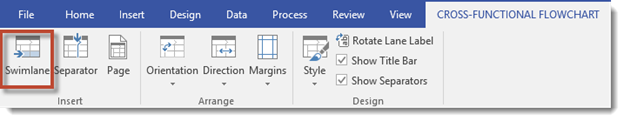
Click on the Cross-Functional Flowchart tab that appears in the ribbon.
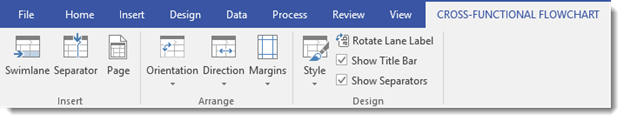
Click on the Swimlane button in the Insert group.
Another swimlane is added.
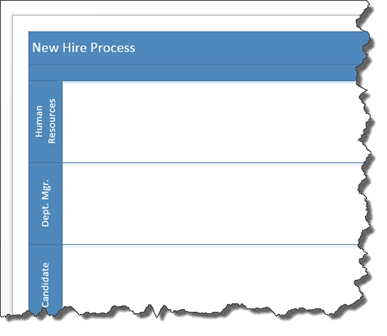
Now, let's label our diagram by adding a title for the diagram, then adding departments. We could also add people if we wanted.
Click the Title band and add a title to your diagram. Next, click Function and add a department or person.
You can now drag stencils and add connectors to link together shapes, just as we did with flowcharts.
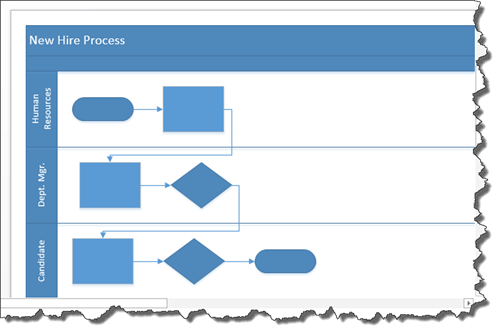
When you're finished, you can add text labels to the shapes as we did in the last section. These can be the same labels that we used for the flowchart. The difference is now they appear next to the department responsible for the steps.
Creating Organization Charts
An organization chart is used to show the structure of something like a company and depicts a hierarchy. You can use the Organization Chart Wizard to create an organization chart, or you can create one by hand. We're going to teach you both methods, starting with creating one by hand.
Go to the Backstage View by clicking the File tab, then click New on the left.
Click on the Organization Chart template. Open the template.
The Organization Chart Wizard will appear over the Drawing window.

Visio will ask you if you want to use the wizard or if you want to enter information that's already in a file. Since we're creating an organization chart by hand, we're just going to click the Cancel button.
This will take us back to our Shapes window and Drawing window.
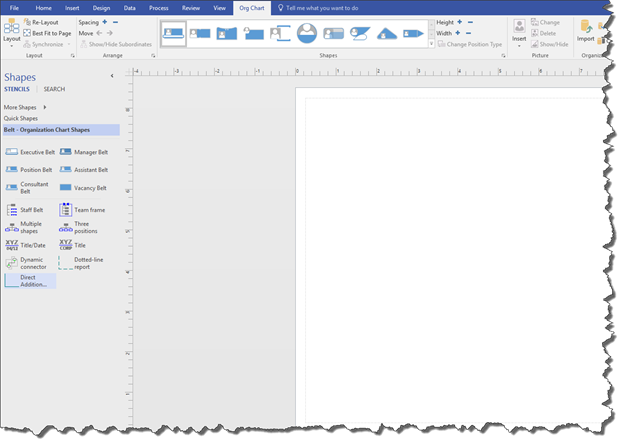
Let's take a look at our stencils.
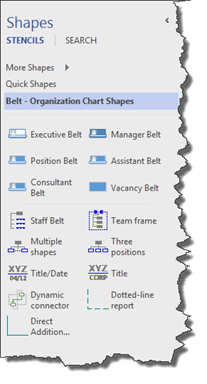
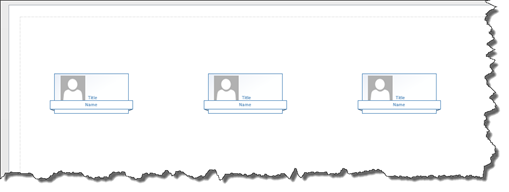
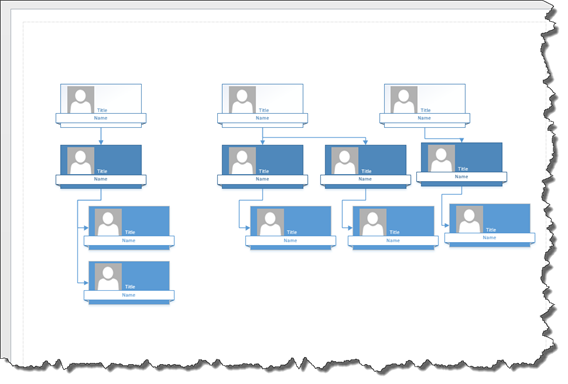
Drag an Executive Belt shape into the Drawing window. Since an executive is at the top of a hierarchy, place it near the top of the page. Add two other executive shapes beside the first, as shown below. Use the Dynamic Grid to align and space them.
Next, drag four Manager Belt shapes, then five Position Belts below the manager shapes. Use the Dynamic Grid to fit all the Position Belts on the page with even spacing.
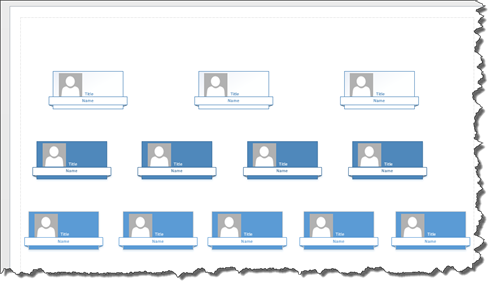
Now that we can see the hierarchy, it's time to connect the shapes.
To connect the shapes, right click anywhere on the page and select the Connection Tool. Then click to select a shape and drop it on the shape that represents the next level above it.
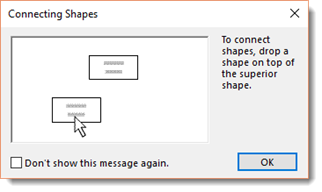
In other words, connect from the bottom up by dragging a shape and dropping it on the shape that comes above it. This is the easiest way to connect shapes in an organization chart.
You can also use the Org Chart tab in the ribbon to change shapes in your chart, as well as other options.
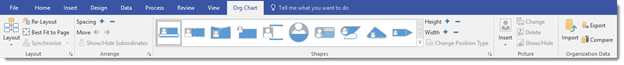
To change a shape, click the shape in the Drawing window.
Go to the Org Chart tab in the Ribbon and select the new shape in the Shapes group.
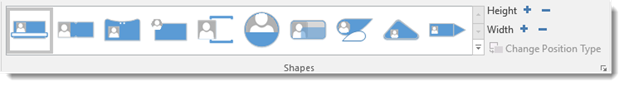
Notice that it changes all shapes in your chart.
It also changes the stencils that appear in the Shapes window.
The Organization Chart Wizard
You should use the Organization Chart Wizard when you already have data in an electronic format that will be used for the chart.
For example, if you have an Excel spreadsheet or workbook that has names and information, an ERP system that can create an Excel or text file, data in a database such as Access, or data in a Microsoft Exchange Server directory.
For the purpose of this lesson, we're going to teach you how to use the Organization Chart Wizard with an Excel workbook.
Go to Backstage View and click New. Open the Organization Chart template.
The first window of the wizard automatically opens in the Drawing window.
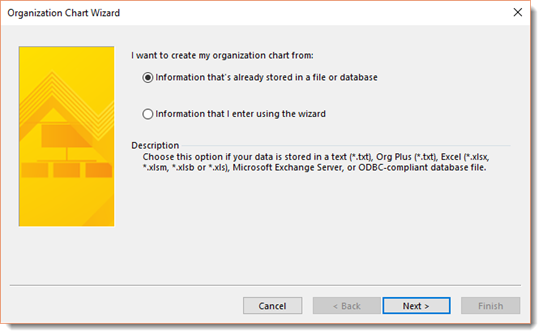
Leave the default option checked.
Click the Next button.
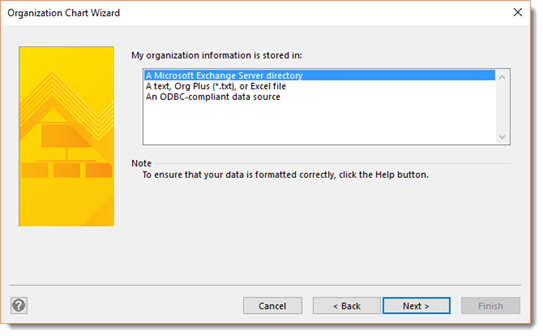
Select "A Text, Org Plus (*.txt), or Excel File.
Click the Next button.
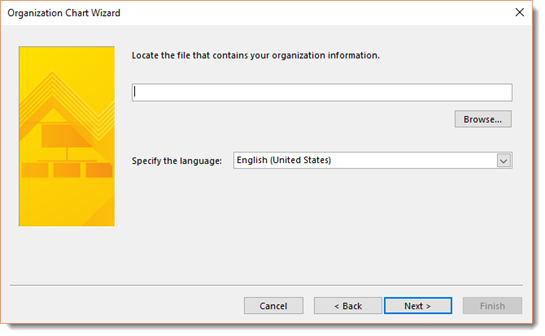
Click the Browse button, then locate the file that contains the data.
Specify the language you use in the data.
Click Next.
Visio will open and read the data that's in the spreadsheet. The column names will decide which hold the names and structure information. On the next page in the wizard, Visio will display the column names that it thinks are the best match.
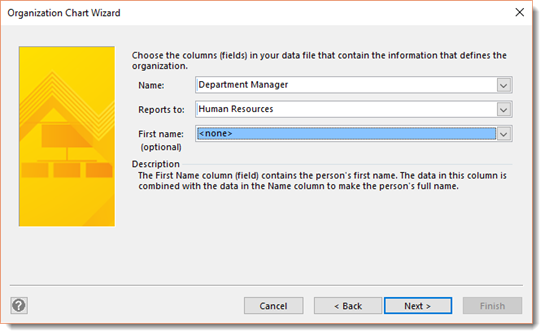
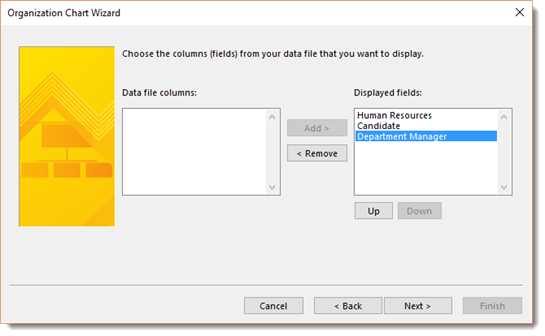
Click the Next button. In the next window, you can tell Visio which employee data is to be displayed on each shape.
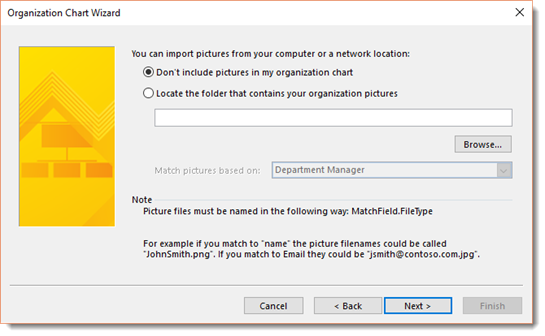
In the next dialogue box, you can specify any pictures you want to use.
When you click the Next button, you'll be able to decide if you want to specify how much to display on each page.
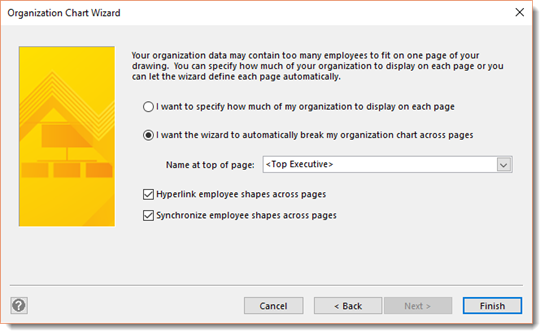
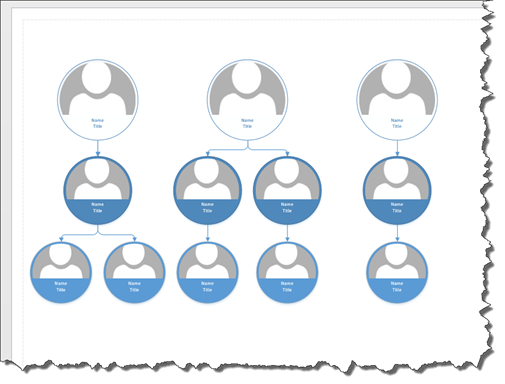
When you click the Finish button, your organization chart is created for you.
To customize the layout of any chart, go to the Org Chart tab in the ribbon. Click the Layout button.
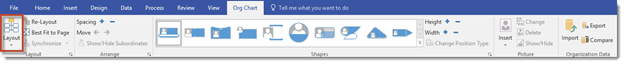
Choose a new layout from the dropdown menu.