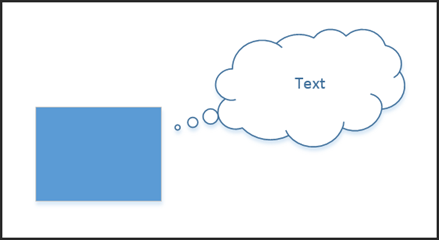
In this article, we're going to talk about creating data graphics, which give you a way to show your shape data in your drawings in several different ways.
You'll learn:
-
About data graphics and what they are in Visio 2013
-
How to create the four different types of data graphics
-
How to apply existing data graphics to different shapes
-
How to edit data graphics
-
How to remove a data graphic from a shape
About Data Graphics
A data graphic is just as it sounds. It's a graphic that shows your shape data. It shows it as a combination of text and symbols, such as flags, numbers, and progress bars.
Here's an example. Let's say that you have a process shape that represents interviewing a candidate for a job. The shape data contains information about the interviewer, job title, interview date, etc.
You can see it here:
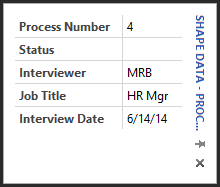
Using data graphics, you can take that shape data and show it visually in the drawing.
Let's learn how to do that.
Create a Data Graphic
There are four types of items that you can add to a data graphic. They are:
-
Text
-
Data bars
-
Icons
-
Color coding
We are going to teach you to create and add each in this article.
Adding a Text Graphic
When you add a text graphic to a shape, you can choose from a callout or text heading.
To add a text graphic, select the shape for which you want to create a data graphic.
Go to Data>Data Graphics.
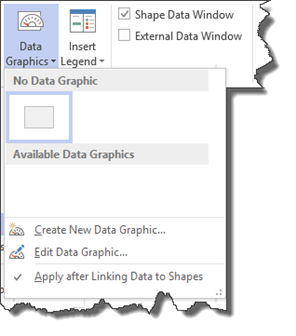
Select Create New Data Graphic.
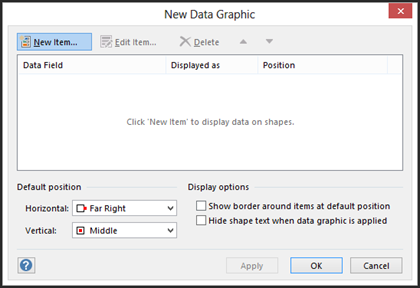
Click New Item.
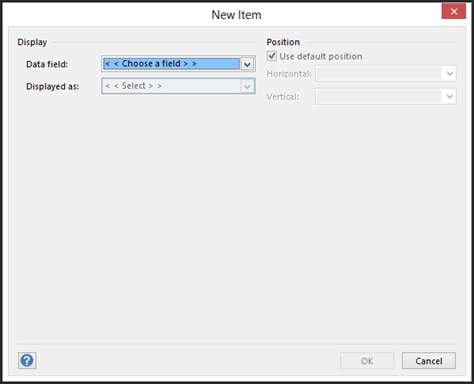
Under Display in the Data Field List, choose the data field that you want represented.
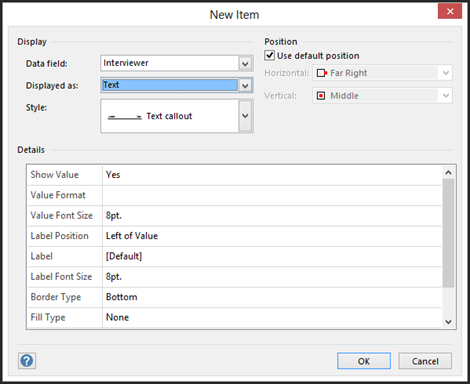
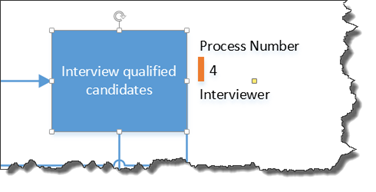
We chose the Interviewer data field and to have it displayed as text.
For the style, you can choose a callout or heading style, as we mentioned earlier in this article.
You can also set options for:
Position. You can select the default position or specify another by clearing the Use Default Position box, then click Horizontal or Vertical and select the positions you want.
Details. Determine how ou want the callout our heading to look.
Click OK.
Click OK in the New Data Graphic dialogue box.
Click Yes to apply the data graphic to the shape.

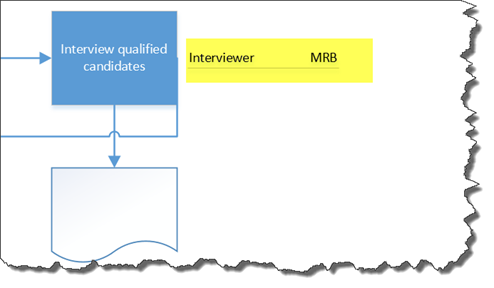
We higlighted the data graphic in the snapshot below.
Adding a Data Bar
Data bars show your data in mini charts and graphs. These include progress bars, star ratings, speedomoters, and thermometers.
To create a data bar graphic, go to Data>Data Graphics>Create New Data Graphic.
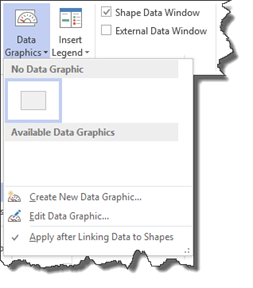
Click New Item in the New Data Graphic dialogue box.
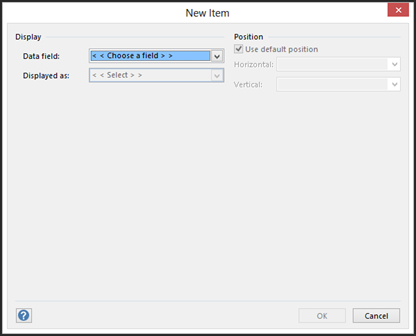
Choose a data field.
In the Displayed As field, select Data Bar.
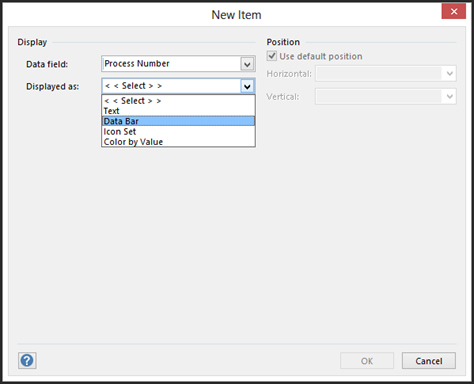
Choose a style for your data bar, then a position.
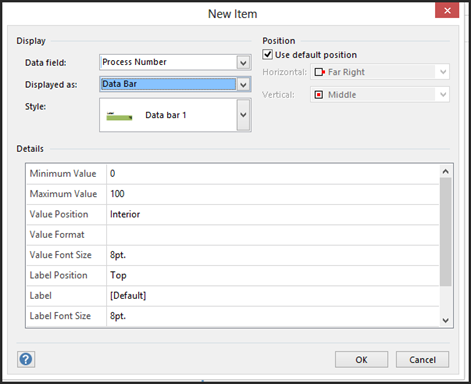
Click OK to return to the New Data Graphic dialogue box.
Let's click New Item again. You can keep adding new items to any data graphic, even text. The new items represent shape data.
Follow the steps above to select a data field, the type of data graphic, the style, and position.
Click OK.
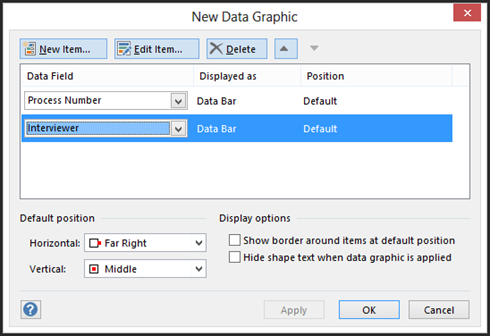
As you can see in the snapshot above, we added Interviewer to our data bar.
Click OK.

Click Yes to apply.
Adding an Icon Set
In Visio 2013, you can use sets of icons such as trend arrows, traffic signals, and flags to represent shape data. You can have these icons displayed to represent values, dates, and the list goes on. For example, you can have a blue arrow to represent when sales data is up, then red when it is down. The color of the arrow icon would depend on the shape data.
To create an icon data graphic, follow the same steps listed above for text and data bars.
Go to Data>Data Graphics>Create New Data Graphic.
Click New Item in the Create New Data Graphic dialogue box.
In the New Item dialogue box (pictured below), select a data field, then how you want that data displayed. We are going to choose Icon Set.
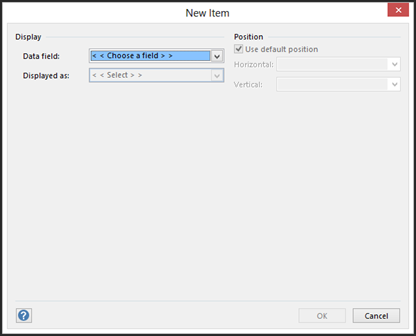
You'll then see this:
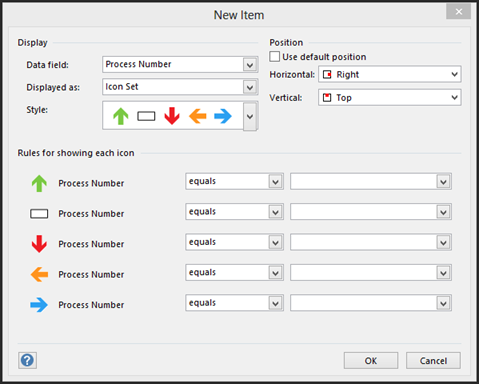
Select your options.
-
Displayed As. This should already be set to Icon Set.
-
Style. Choose the icon set that you want to use.
-
Position. You can either use default position, or uncheck that box and select the positions you want.
-
Rules for Showing Each Icon. Choose the values that each icon will represent.
Click OK.
Follow the steps you took for text and data bars to add more items or apply the data graphic to your drawing.
Applying a Fill Color by Data Value
You can also choose to specify a certain fill color for a shape to represent the data of that shape. For example, if the shape was a chair you were selling, you could use colors to represent sales volume for the chair.
To apply a fill color by data value, go to Data>Data Graphics>Create New Data Graphic.
Click New Item in the Create New Data Graphic dialogue box.
Just as with the previous data graphics, choose the data field, then how you want the data field displayed.
This time we are choosing Color by Value.
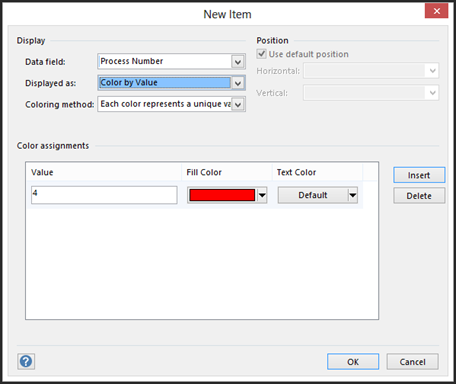
For Coloring Method, choose if you want each color to represent a unique value, or each color to represent a range of values.
Set your other options for applying a fill color.
For color assignments, which data field values to apply for each fill color. In addition, select the fill and text colors.
Click Insert to create more fill colors.
Click OK when you're finished.
Using Existing Data Graphics
Once you create data graphics, you can apply those data graphics to other shapes in your drawing.
Earlier in this article, we used the process shape to create a data graphic. To be specific, we used this process shape, which now has a fill color data graphic applied to it.

Let's say that we want to apply the same data graphic to another shape. We can easily do that in Visio 2013.
To start out with, we're going to select the new shape. We are choosing another process shape.
Next, go to Data>Data Graphics.
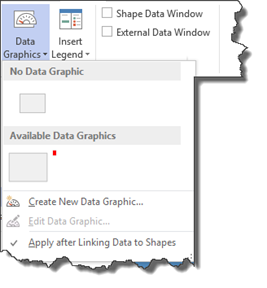
Go to Available Data Graphics.
You can see our current data graphic under Available Data Graphics in the snapshot above.
Click on the data graphic.
Editing Data Graphics
You can also edit an existing data graphic.
To do this, select the shape that has the data graphic that needs to be edited.
Go to Data>Data Graphics>Edit Data Graphic.
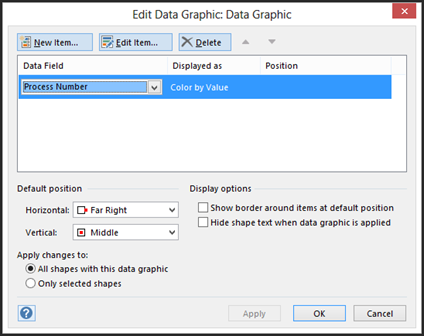
You will then see the Edit Data Graphic dialogue box, as pictured above.
In the Data Field column, select another data field to change the data the graphic represents.
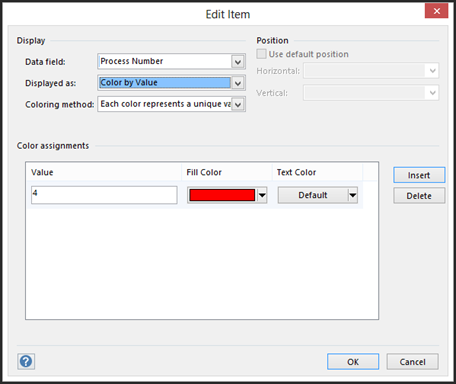
If you want to change font, format, settings, color, or the type of graphic, go to the Displayed As column, then select what you want to change, then click Edit Item. You'll then see the Edit Item dialogue box.
-
Under Display, select the graphic you want.
-
You can change the Position in the same way that you set the position.
Click OK.
In the Apply These Changes to section of the Edit Data Graphic dialogue box, select if you want to apply the changes to:
-
All Shapes with this Data Graphic
-
Only Selected Shapes
Click OK.
Remove a Data Graphic
To remove a data graphic from a shape, select the shape for which you want to remove the data graphic.
Go to Data>Data Graphics>No Data Graphic.
Visio 2013 offers you the ability to group shapes so that you can add structure to your drawings. As you use Visio, you will find that you group shapes that you want to keep together in your drawing. That way, if you move one, you move them all. It saves time over moving them one at a time, and that saves aggravation.
That said, however, you are the only one who knows when you group shapes together. Nobody else can see the grouping because the border around the group becomes invisible. In addition, you can't add other shapes to the group without ungrouping, then regrouping. That can quickly become a hassle as well.
In this section, we'll explore:
-
Why visible structure is important
-
Containers vs. grouped shapes
-
Adding containers
-
Adding shapes to containers
-
Formatting containers
-
Using callouts
-
Associating callouts with shapes
Why Visible Structure Is Important
We're going to spend this section talking about containers and lists. Both of these things give you a way to add visible structure to your drawings.
Visible structure is as important as any other aspect of your drawing. It's as important as connecting shapes together in a flowchart. It's as important as adding shape data to rack diagrams or floor plans. It's as important as organizing your shapes on your page so it looks like a flowchart or diagram – and not a jumbled mess.
When you add visible structure to your drawings, you're guiding viewers where to look and what to look at. You're saying, "here is this information," and "over here is where you'll find that." Even the most organized flow chart can be overwhelming to look at. By adding structure using containers and lists, you make it simpler. You make it more attractive. And you make it more effective.
You can think of all that as the cake. The methods we're going to learn in this section to create visible structure are the icing.
Containers vs. Grouped Shapes
Before we go any further in this section, perhaps it is important to further clarify the differences between containers and grouped shapes. It will be helpful to know the differences as we move forward in this section, as well as for when you use Visio 2013.
-
Containers are collections of shapes that have a visible border around them, while grouped shapes have an invisible border.
-
If you delete a container, you delete the shapes in the container. You can't delete a group. You can only ungroup shapes.
-
When you move a container, the shapes move with it. The same holds true for grouped shapes.
-
If you copy and paste a container, you also copy and paste the shapes. You can copy and paste a group as well.
-
Containers have headings, meaning you can add a text label. Groups do not.
-
You can choose a container style to customize the look of your container. Grouped shapes, again, have an invisible border.
Adding Containers
It's easy to add containers. The first part of the process is like grouping shapes, so it will seem familiar.
Start out by selecting the shapes that you want to contain.
Go to Insert>Container.
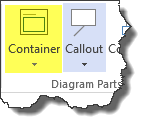
You can hover your mouse over the styles to see a preview of each container on the page.
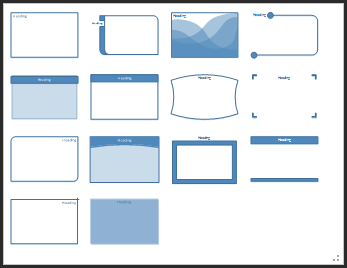
Click on a style from the Container dropdown menu to apply it.
Type in the heading for the group of shapes.
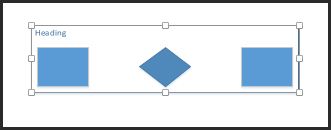
If you don't have any shapes selected when you add a container, the container is placed in the middle of the view. It will not contain any shapes.
Adding Shapes to a Container
You can add a shape to a container by dragging the shape and dropping it inside the container. When a shape inside a container is selected, the container glows slightly, letting you know it is a contained shape.
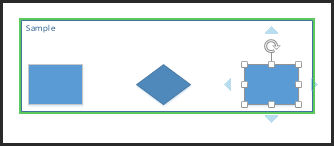
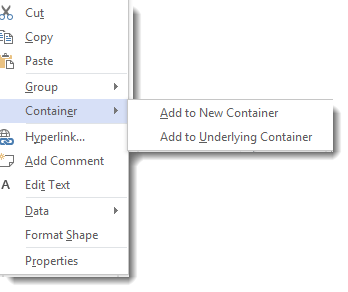
If you don't see the container glowing when a shape in it is selected, move the shape a little. You can also add the shape to the container by right clicking on the shape, then going to Container>Add to Underlying Container.
Formatting Containers
Visio 2013 gives you tools to format your containers so they look like you want.
To format a container, first select the container.
You'll then see the Container Tools tab appear on the ribbon.

Under this tab, you can:
-
Set the margins for your container
-
Resize containers
-
Change the style of the container, which will also change the appearance
-
Lock the container. This means that shapes cannot be added to the container or deleted from it.
-
Select contents means all the shapes in the container are selected.
-
Disband container means that the selected container is deleted, but the shapes it contained are left behind.
You can also go to the Home tab and use the paragraph tools to set the position of the header or the font tools to format the header text.
Using Callouts
A callout is an annotation shape. It describes other shapes in a drawing. A callout can be associated with a shape and will move with the shape if the shape is moved.
Let's learn how to use a callout.
First, select a shape that you would like to associate with a callout.
Next, go to Insert>Callout.
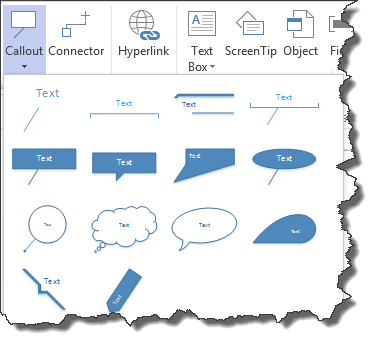
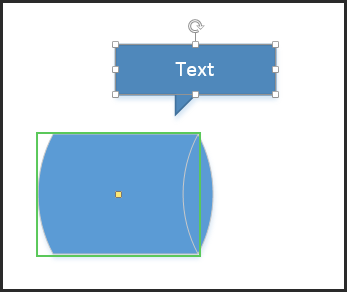
Choose the style of callout that you'd like to use with the shape. You can hover your mouse over a callout to see a preview of how it will look in your drawing. Click on a callout to select and and associate it with your shape.
If you want to change the callout style after you've selected one, right click on the callout and select Callout Style. Choose another style.
Associating a Callout with a Shape
You can add a callout to your page without selecting a shape. When you do this, the callout appears in the middle of your current view.
To associate a callout with a shape, click the yellow control handle for the callout, as circled in red below.
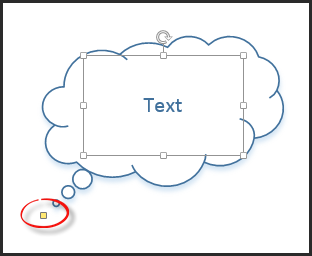
Drag it to the shape that you want to associate it with. Drop the control handle on the shape. It is very important that the control handle is dropped ON the shape, not on the border or near the shape. This is the only way to associate the callout with the shape.
Now you can move the text part of the callout to where you want it.
