Visio 2013 gives you a lot of the tools that are available in other Office programs to add colors, styles, themes, and even special effects to your drawings.
In this article, you'll discover how to:
-
Use the rulers and grid
-
Align shapes
-
Position shapes
-
Apply themes, variants, and Quick Styles
-
Work with fill colors and patterns
-
Change line style and color
-
Add special effects
Using Rulers and Grids
There is one thing that can make even the most organized chart or diagram look bad. That one thing is if your shapes are out of alignment, and your drawing looks like a small earthquake came through and bounced around your shapes.
Take a look at the example below:

These arrows should all be evenly spaced on the page. The two top arrows should be aligned, and the two bottom arrows should be aligned.
Use the rulers at the top and left sides of the page to place objects.
Whenever you select and move a shape, you can see where you're placing it by looking at the ruler.
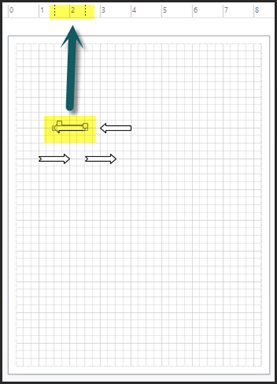
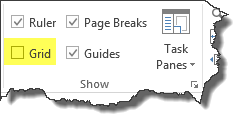
To help you place shapes, you can also go to the View tab on the ribbon. Put a checkmark beside the Grid box to view the grid.
When you put a checkmark in the grid box, this is what you will see on your page:
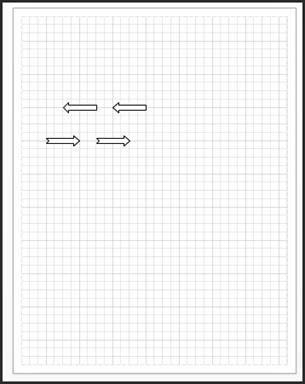
You can use the grid to line up your shapes and create equal spacing between shapes.
Aligning Shapes
Visio 2013 gives you the ability to align shapes horizontally or vertically. If you align shapes vertically, you can them shapes to either their left or right edges � or their centers.
Look at the shapes below.
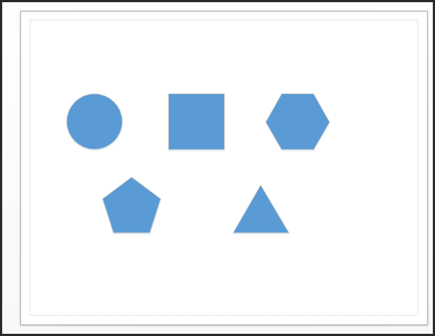
To align the shapes on the top row, drag a bounding box around those shapes.
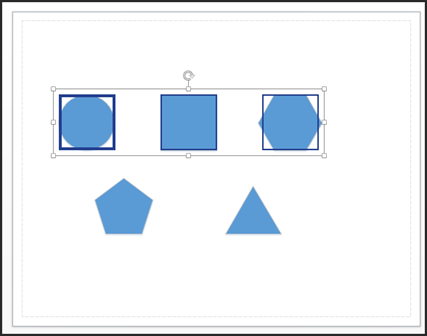
Next, go to Home>Align. Choose if you want to align left, center, or right.
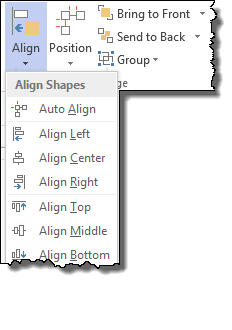
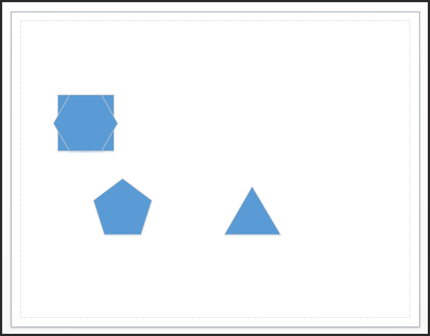
To align them horizontally, align them to either the top, middle, or bottom by making the matching selection from the Align dropdown menu.
In the example below, we've drawn a bounding box around all the shapes on our page.
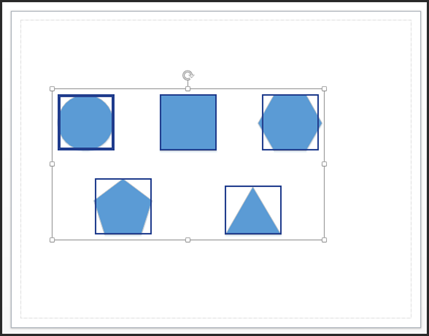
Next, we're going to choose to align them to the middle of the shapes (Align Middle).
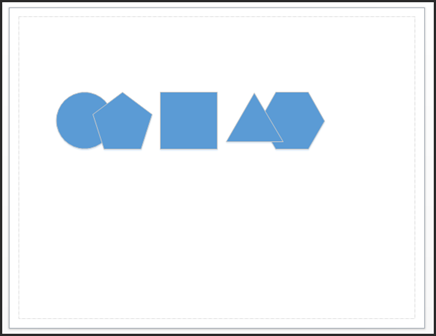
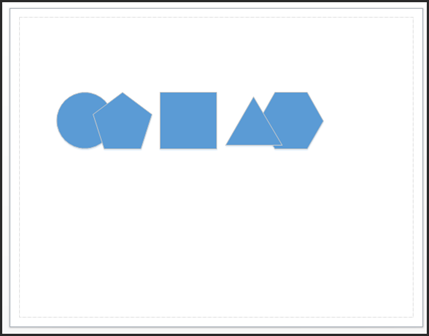
To further illustrate how align works, we have aligned to the top of the shapes in the snapshot below.
Positioning Shapes
Having even spacing between shapes is also important in drawings. In order to position shapes so they have even spacing between them, first select the shapes to put a bounding box around them.
Next, go to Home>Position.
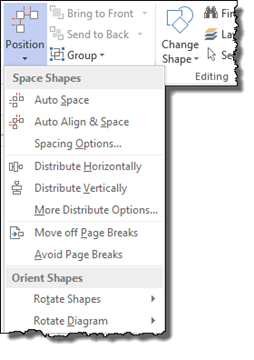
Hover your mouse over Auto Space to see how the anchor shape stays in place, but the other shapes are moved to that the distance between the edges of the shapes is the same. The anchor shape is the furthermost left shape. It will have a darker border than the rest when the bounding box is around the shapes.
Of course, you can click on Auto Space if you'd like to select it.
However, you can also choose to distribute the shapes evenly. If you choose Distribute Horizontally, the two outer shapes are left in place, and the other shapes' spacing is adjusted accordingly.
Applying Themes, Variants, and Quick Styles
Themes, variants, and Quick Styles are aspects that you can apply to your drawings to add and change color, apply special effects, and further customize your drawings to achieve the look and feel you want.
-
A theme includes the colors, fonts, and effects in your entire drawing.
-
A variant is simply a variation of a theme.
-
A Quick Style applies to individual shapes whereas themes and variants apply to the entire drawing.
We're going to learn how to apply all three in this article using the office floor plan we created.
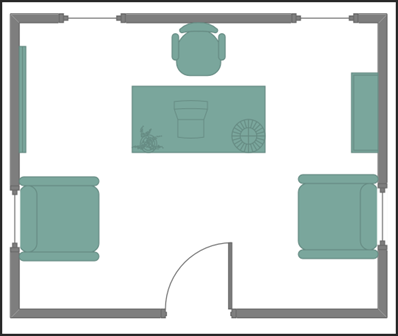
To apply a theme, click the Design tab, and look at the Themes group. You can hover your mouse over any of these themes to take advantage of Live Preview. Live Preview will show you how the new theme will change the look of your drawing without actually applying the changes.

Let's hover our mouse over a theme.
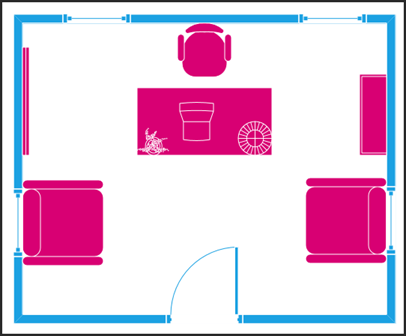
You can see how the new theme changed the colors.
Now, let's add some text to our drawing to see how the theme also applies to fonts. For this, let's go back to our original drawing.
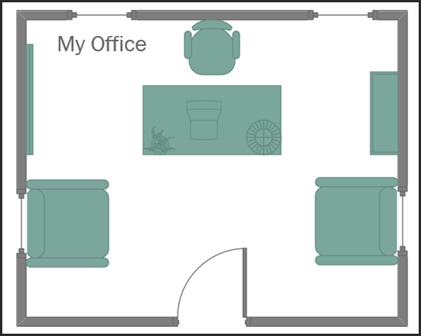
As you can see, we added a horizontal text box and the text "My Office."
Now let's hover our mouse over a new theme again.
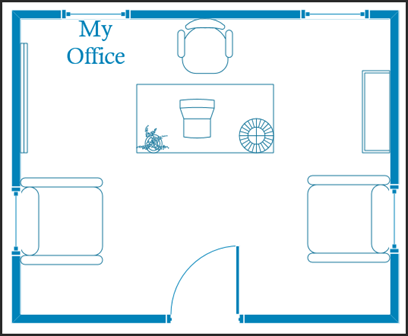
You can see how the font has changed, as well as the colors.
If you want to apply a theme, just click on the theme thumbnail in the ribbon.
We've selected the theme above as our new theme. Now, we're going to apply a variant of the theme.
To do this, go to the Design tab, then the Variants group.
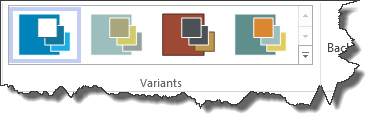
You can hover your mouse over any of the variants to see how they modify the theme. You can also click the downward arrow on the right side of the Variants gallery to see variant options to change the color, effects, connectors, or add embellishment.
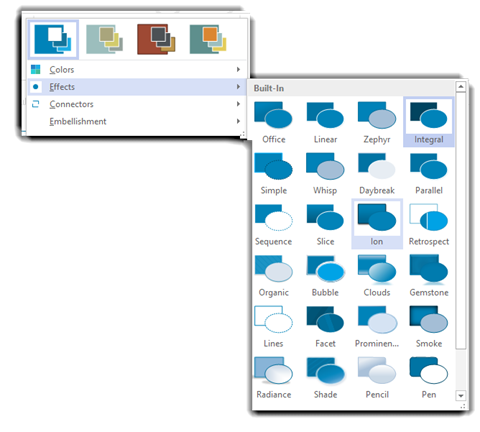
We're going to choose an effect first. Ion is the effect we've chosen.
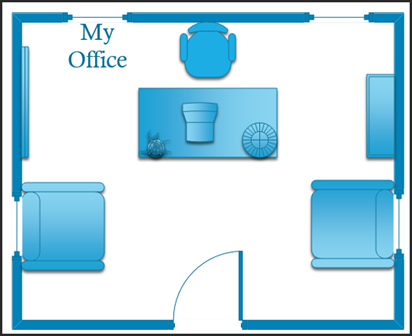
Next, let's choose a color variant. We've chosen Daybreak.
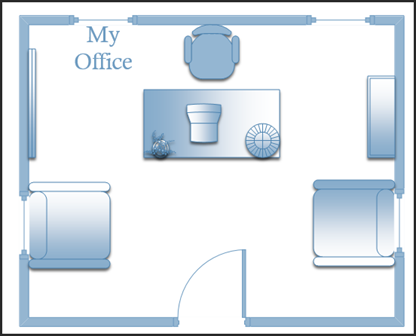
Remember, in addition to themes and variants, we can also apply Quick Styles to individual shapes. Let's apply a Quick Style to the door.
To do this, first select the door.
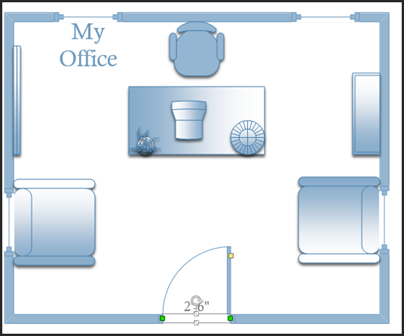
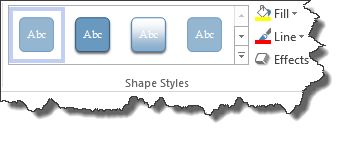
Go to the Home tab, then the Shape Styles group. You can hover your mouse to preview the different styles available to change the look and feel of your shape.
Fill Colors and Patterns
There are two types of colors that apply to shapes. These two types of colors are line and fill colors. Line colors are the borders of your shapes. Fill colors are the colors inside your shapes.
To apply a fill color to a shape, you can right click on the shape, select Format Shape.
You will see this window appear on the right side of your Visio window:
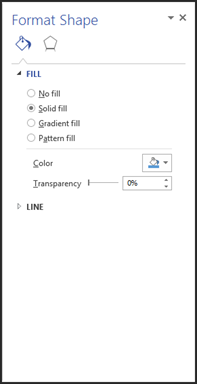
Click the arrow beside Fill to see the options displayed below.
You can choose to apply:
-
No fill
-
Solid Fill
-
Gradient Fill
-
Pattern Fill
Solid Fill
Let's apply a solid fill first by putting a check in the box.
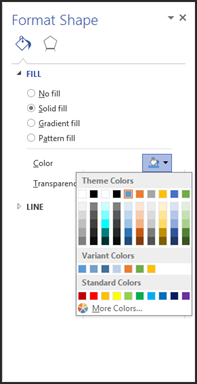
Choose a fill color, as shown below.
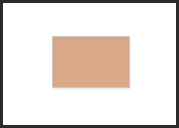
Next, choose the transparency. Set the transparency as a percentage. We're going to set ours at 50%.
You can also change the fill color by going to Home>Fill in the Shape Styles group.
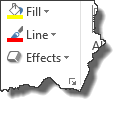
If you want to apply a fill to more than one shape, hold down the Shift key while selecting shapes.
Gradient Fill
To apply a gradient fill, check the Gradient Fill box.
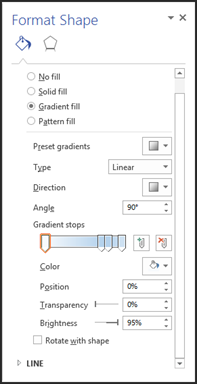
Select a preset gradient.
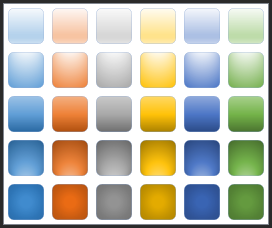
Choose a direction for the gradient.

Select the angle of the gradient and the gradient stops.
Next, choose a color, as well as the position, transparency, and brightness.
If you want the gradient to rotate with the shape, make sure the "Rotate with Shape" box is checked.
Pattern Fill
A pattern fill does just as the name applies. It fills your shape with a pattern.
Let's choose Pattern Fill.
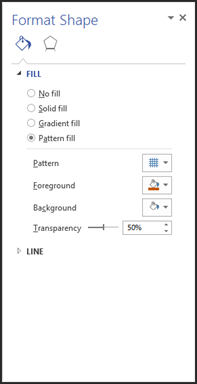
Choose the type of pattern you want to use for your fill.
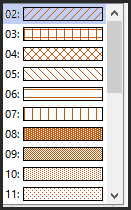
Next, choose the foreground and background colors. In the patterns above, orange is the foreground color, and white is the background color.
Changing the Line Color and Style
Just as with fills, you can change the line color of shapes in two different ways. You can right click on a shape, then select Format Shape.
When the Format Shape opens on the right, click the triangle beside Line.
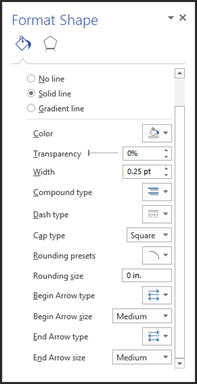
From here, you can set your line options, including the type of line. It's a good idea to play around with these options to see what they do. There are endless combinations you can use to customize your line.
Keep in mind that most of these options apply to lines you've drawn on your pages and not the lines that create the borders for your shapes.
You can also go to Home>Line to change the line color.
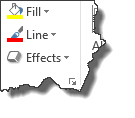
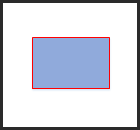
We've changed ours to red.
Adding Special Effects
If you've used other Office 2013 programs, then chances are you're already familiar with special effects. The same special effects that are available in programs such as MS Word are also available to apply to shapes in Visio 2013.
To apply a special effect to a shape, go to Home>Effects.
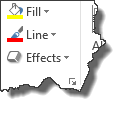
Choose which type of effect you'd like to apply by clicking on the downward arrow beside Effects.
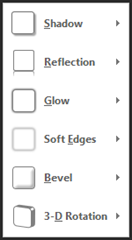
You can then choose how to apply the effect:
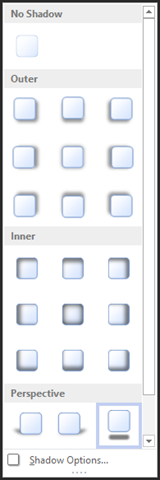
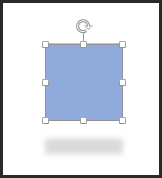
We've chosen to add a shadow to our shape below:
Working with Data
Data is one of the most important aspects of Visio 2013. Without the data capabilities that the program contains, it would be nothing more than an overdressed SmartArt or chart creation program like you see in other Office programs such as Word.
While it's true that Visio 2013 gives you all the tools you need to create all types of drawings, then customize the look and feel of each, the true benefit if Visio lies in the data tools that it provides. Flowcharts and diagrams are only mere drawings without data to back them up, and Visio gives you all the methods that you need to incorporate and link to that data.
In this article, we'll learn about:
-
The different types of shape data
-
How to view shape data
-
Shape data attributes
-
Linking diagrams to external data sources
-
Updating diagrams with refreshed data from external sources
-
Linking data to shapes
-
Creating predefined and custom reports
-
Creating hyperlinks to link shapes to websites and local files
Types of Shape Data
Shape data is data that describes properties of your shape. There are eight types of shape Data in Visio 2013. These are:
-
String, which is free form text.
-
Number, which is numeric data.
-
Fixed List, which is a dropdown list that allows viewers to choose an option.
-
Variable List, a dropdown list that allows viewers to choose an option or add some of their own by filling out a text box.
-
Duration, which is time expressed in either seconds (es.), minutes (em.), hours (eh.), days (ed.), or weeks (ew.).
-
Date, which is a calendar date.
-
Currency, which is money units based on the user's region and language (in Windows).
-
Boolean, which is true or false.
Viewing Shape Data
To view shape data, right click on the shape, then select Data. You will see the data submenu.
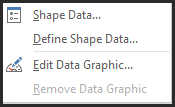
Choose Shape Data.
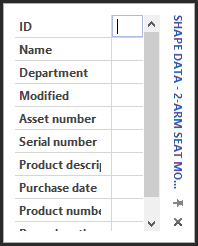
Shape Data Attributes
You can also add data fields for a Visio shape. For example, maybe you want to add the warehouse location for the chair selected in the snapshot below.
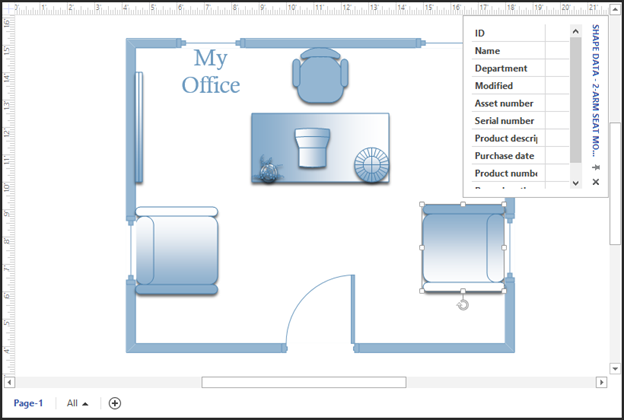
To do this, right click on the shape, go to Data, then Define Data Shape.
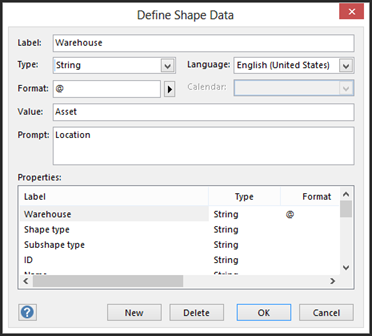
You will then see the Define Shape Data dialogue box.
Click the New button for a new attribute.
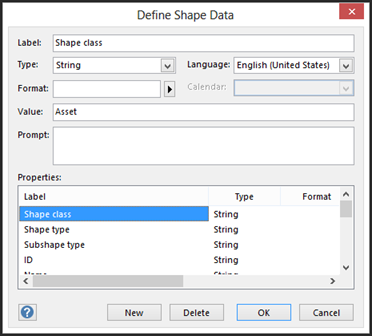
Let's discuss the information you'll need to enter in this dialogue box.
-
Label is field name.
-
Type is one of the eight data types
-
Format will dtermine how data will be presented.
-
Value is the value entered when a shape was defined.
-
Prompt is a tooltip that appears when the mouse is over the shape.
Click OK when you're finished.
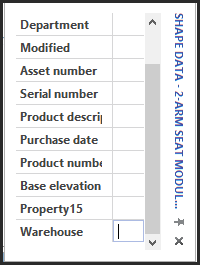
The new attribute appears in the shape data.
Linking Diagrams to External Sources
You've already learned how to manually enter shape data in Visio 2013. However, you can also link to data from external sources, such as a spreadsheet, database, or other source.
While data linking to external sources was complicated and confusing with prior versions of Visio, Visio 2013 makes it a lot easier. All you have to do is link the diagram to a data source, then link the individual shapes to the data.
Let's learn how to do this.
First, go to Data>Data Graphics.
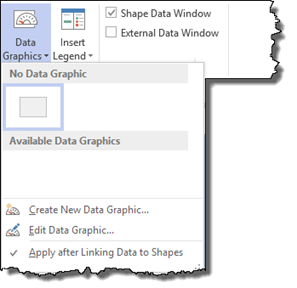
Remove the checkmark that comes before "Apply after Linking Data to Shapes."
Next, go to Data>Link Data to Shapes. You will then see the Data Selector wizard.
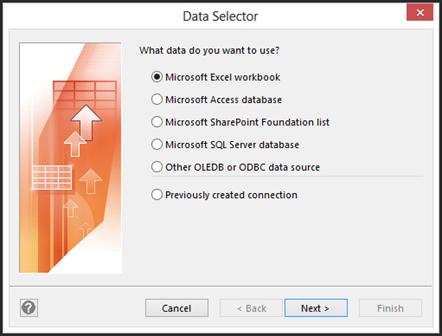
Select where the data is located, then click Next.

Locate the data file, then click Next again.
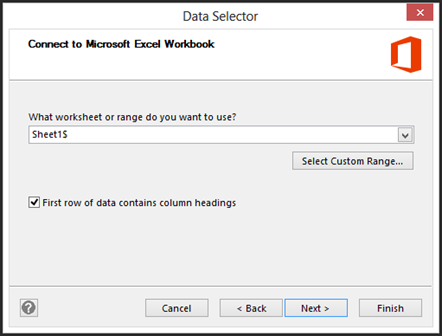
In the snapshot above, we'll select our range, then click Next.
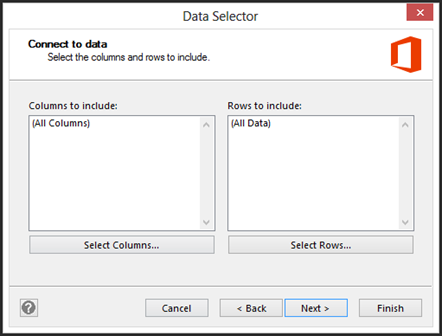
As shown in the snapshot above, you'll next be asked to specify what columns and rows you want to include.
Click Next.
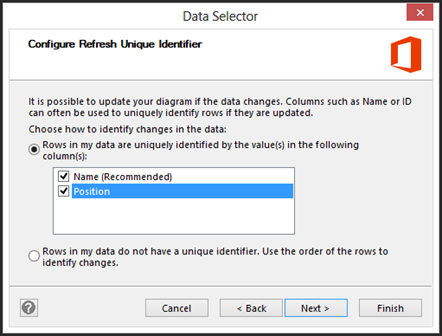
If you update the data in the external source, the data in your diagram can also be refreshed. Visio 2013 asks you to choose how you want to identify changes in the data.
Since our rows have unique identifiers (the column headers), we specified that.
Click Next.
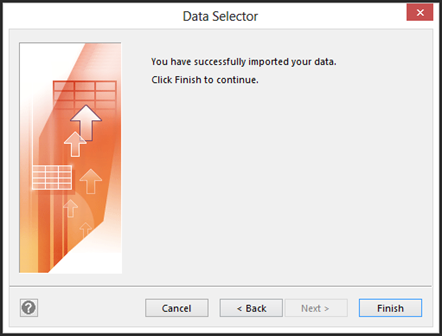
Click the Finish button.
You'll then see the rows of data below your drawing.

Drag a row of data to a shape to link the data to that shape.

Refreshing Linked Data
Once you have data linked to an outside source, you need a way to refresh that data to reflect additions, subtractions, or changes.
The first step in doing this is making the changes in the external data source, then saving those changes. Using the example above, we would make changes to our Excel workbook.
Next, go to Visio, then Data>Refresh All.
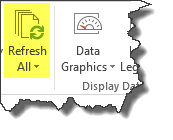
Click the button and not the arrow for Refresh All. Visio will then look at the data from the lined source. You'll see the results in the Refresh Data dialogue box.
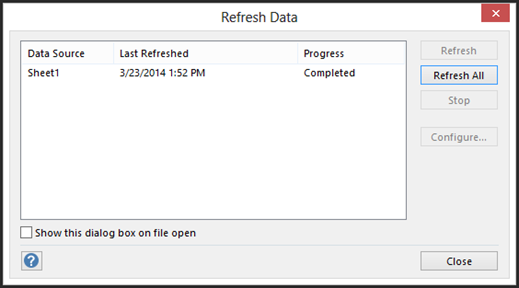
Click Close.
Linking Data to Shapes
Earlier in this article, we talked about linking diagrams to external data. Now we're going to learn how to link data to shapes.
For this example, we're going to use the process map shown below:
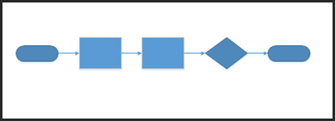
We're going to assign sequential numbers to each process shape. We're going to assign 12 to the first process shape in the Process Number field (go to shape data to do this). We're going to assign 13 to the second process shape.
Next, make sure that your diagram is linked to external data using the steps you learned earlier in this article.
Go to Data>Automatically Link.
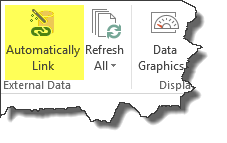
You will then see the wizard.
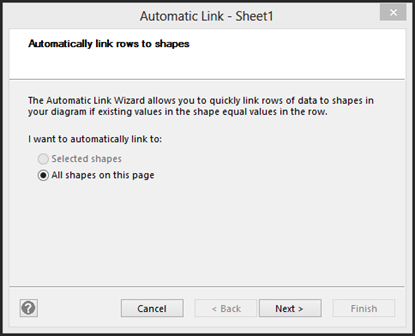
Click Next.
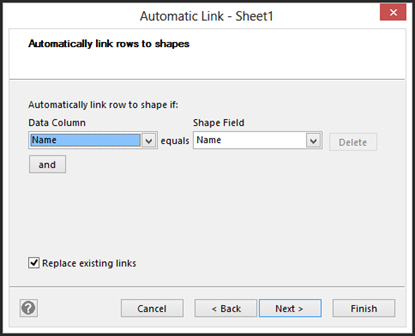
Go to the Data Column section. Click Process Number.
In the Shape Field, click Process Number.
Click Next.
You will then see a summary of your choices in the final window.
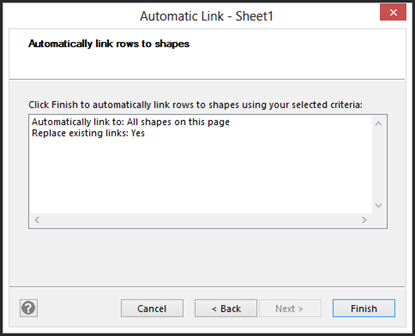
Click Finish.
Creating Predefined Reports
Now that you've entered data into your drawings, you'll want to be able to view that data when you need it. You can do so by running reports.
To run a predefined Visio report, go to Review>Shape Reports.
You will then see the Reports dialogue box.
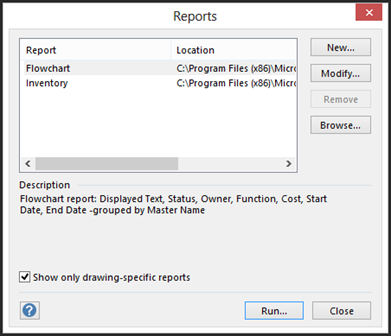
Click on the Flowchart report to select it.
Click Run.
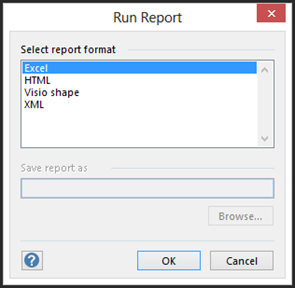
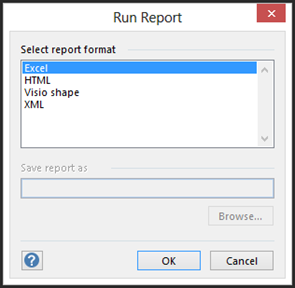
Choose the format for viewing your report.
-
Excel. The report will be presented in Excel.
-
HTML. The report will be presented in Internet Explorer. However, it will be read only.
-
Visio Shape. A new shape will be created to hold your report data. The shape is an embedded Excel object.
-
XML. The report will be presented in an SML file.
For this example, let's choose Excel.
Click OK.
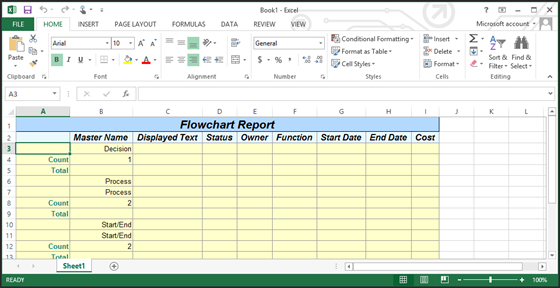
This is a flowchart report. An inventory report will count the occurrences of every shape on a page.
Creating New Reports
You can create your own reports.
Let's learn how to do this.
Go to Review>Shape Reports.
Click the New button.
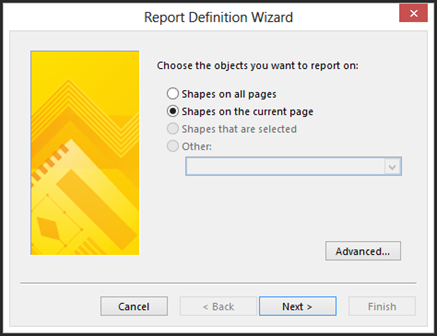
Select Shapes on the Current Page.
Click Next.
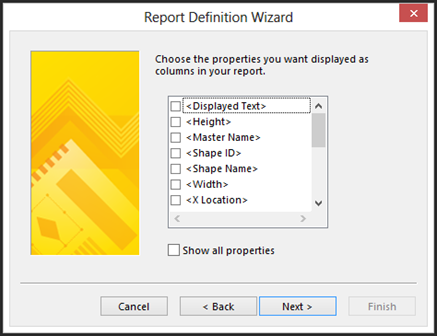
Choose the data you want displayed in the report.
Click Next.
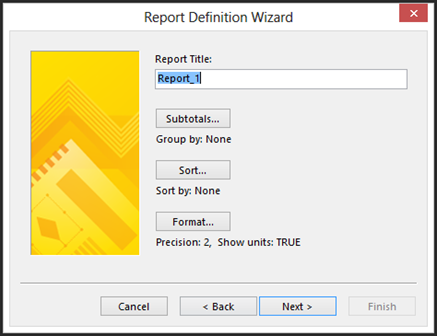
Click Sort to determine the order of the data in your report.
You will then see the Sort dialogue box.
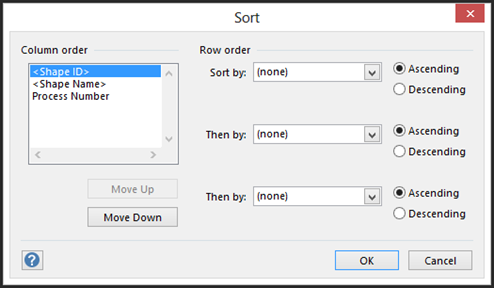
Choose how you want your data sorted, then click OK.
Click Next in the Report Definition dialogue box.
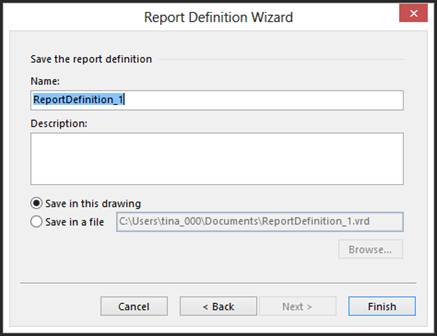
You can now choose to save the report in the drawing or in a file.
Click Finish.
In the Reports dialogue box, click Run.
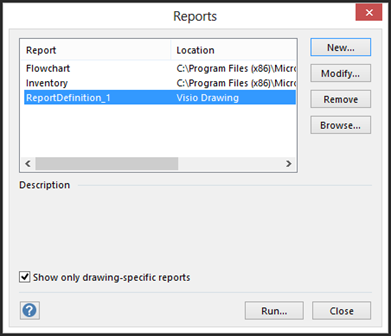
Choose your report format, then click OK.
Creating a Hyperlink to a Website
As well as linking to data, you can also link to websites and documents. We'll learn how to create hyperlinks to documents in the next section. For now, let's focus on hyperlinks to websites.
To create a hyperlink to a website, start out by selecting a shape in your drawing.
Next, right click on the shape and click Hyperlink.
You will then see the Hyperlink dialogue box.
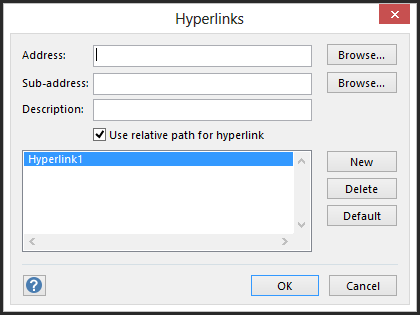
Click the top Browse button. You'll see a menu like the one pictured below.

Select Internet Address.
A web browser will open for you. Type in the web address of the website you want to link to.
The address is filled into the dialogue box.
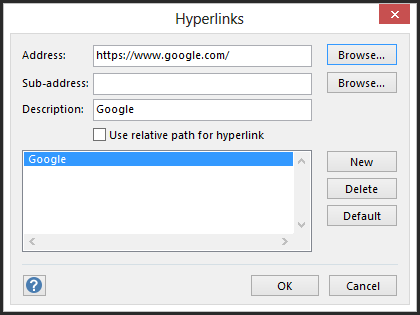
Click OK.
Creating a Hyperlink to a Document
You follow the same beginning steps to create a hyperlink to a document as you did when we created a hyperlink to a webpage.
Right click on a shape in your drawing and select Hyperlink.
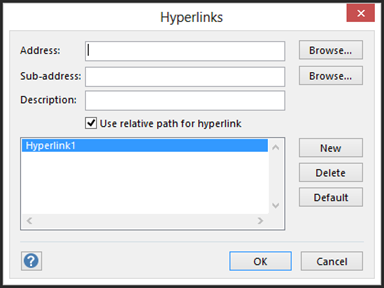
Click the Browse button to see this menu.

Select Local File.
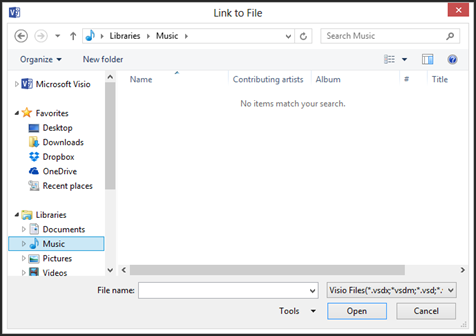
Locate the document in your files, then click Open and find the file. As you can see in the snapshot above, the file type is set to Visio Files.
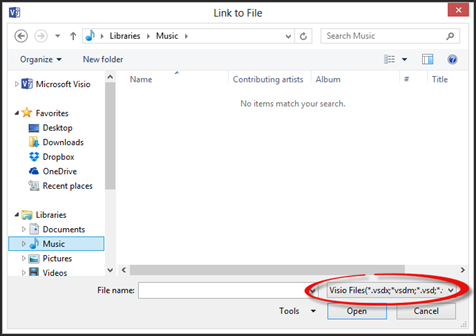
Click the downward arrow to look for other file types.
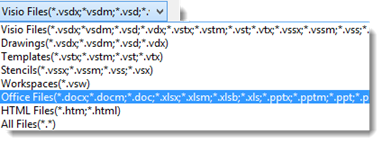
Click on the file once to select it, then click Open.
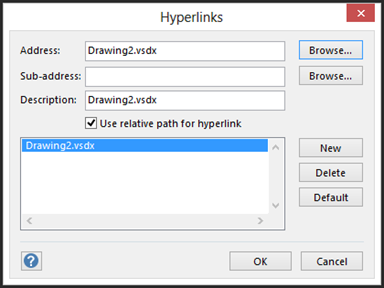
Click OK.


